Mash Screen: what's in my sequencing run?
Last year we published Mash (Ondov et al. 2016) for the rapid comparison of genomes and metagenomes. Mash builds on Andrei Broder’s foundational paper “On the resemblance and containment of documents” (Broder 1997), and uses the MinHash technique to rapidly estimate resemblance, e.g. the similarity of two whole genomes. Mash is great for this purpose, but is not well suited for estimating containment, e.g. detecting genomes contained within a metagenome. Implementing containment was the next logical step for Mash — it is in the title of the Broder paper, after all! Here we introduce a new Mash screen operation that implements containment in the context of genomics.
We have been working on the containment problem since this spring, but were holding back a new Mash release until we could get the accompanying paper written. However, David Koslicki and Hooman Zabeti recently posted a preprint with similar ideas, so we decided to make the new Mash release available and write this short blog in the interim. The following is a brief description of “containment” and the available techniques for computing it.
What is containment?
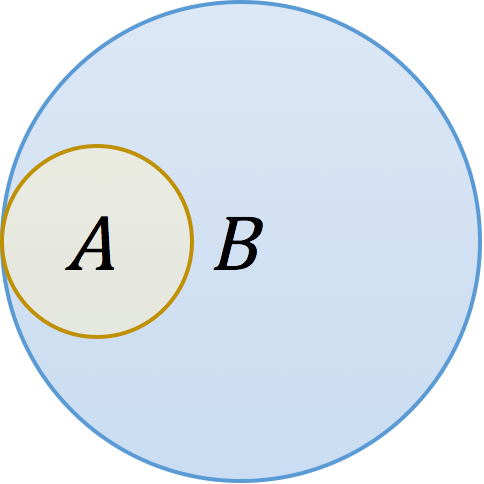
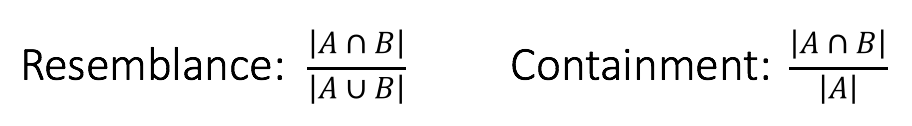
Consider two k-mer sets A and B with the above Venn diagram. Biologically, this could represent a plasmid A contained in a genome B, or a genome A contained in a metagenome B. In either case, the resemblance of these two sets is low because there is a large amount of B that is not in A, yet A is perfectly contained in B. This distinction is reflected in the denominators of the respective formulas:
Thus, containment reports what fraction of A’s k-mers also appear in B. As we describe below, this measure can be estimated very efficiently and has some obvious applications in metagenomics.
The problem with sketches
Mash uses a MinHash bottom sketch to rapidly estimate the resemblance of two genomes (or metagenomes). A bottom sketch is simply a set of the s smallest hash values seen after hashing all k-mers in a genome. Given the mathematical similarity between resemblance and containment, it is tempting to use the same structure to estimate both. However, as Broder noted in his original paper, a bottom sketch is poorly suited to estimate resemblance. The reason is illustrated here with three genomes {a,b,c} that are components of a metagenomic mixture:
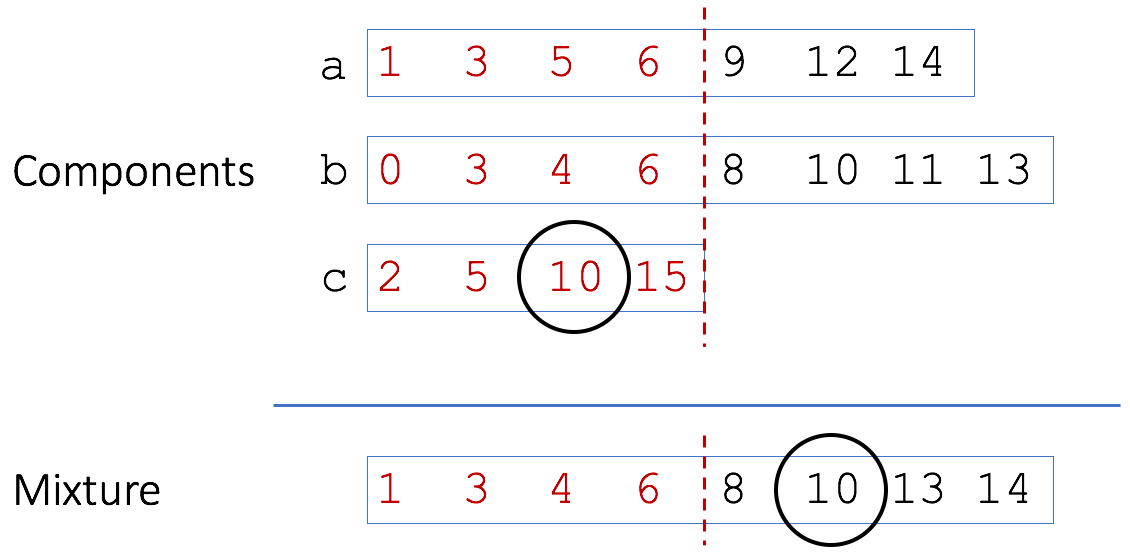
A bottom sketch of four elements is shown (in red) for the three toy genomes and the mixture. In this case we would miss the matching ‘10’ from genome c because it is not included in the bottom sketch of the mixture. Smaller sets, like c, tend to have a wider range of values in their bottom sketch since there are fewer hashes to choose minimums from. Because all the sketches are of a fixed size, these larger hash values get bumped out of the larger mixture sketch. To account for this, Broder originally proposed using modulo operations to build sketches meant for containment estimation. In this way, individual sketches can grow with the size of the sets. For example, using modulo 2 would build sketches of only even hashes (in red):
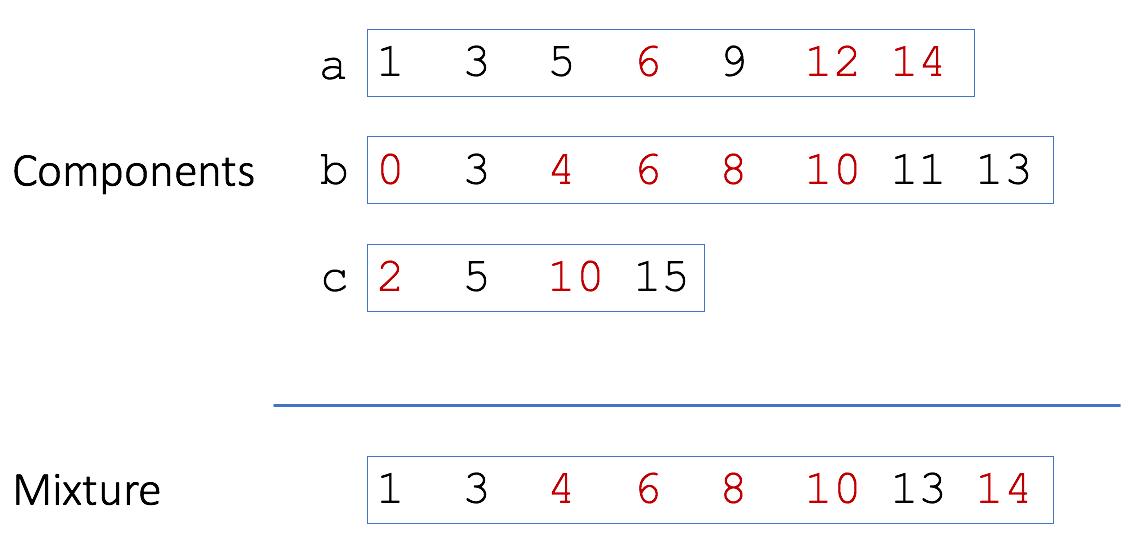
With a sketch of modulo 2, the match of ‘10’ between c and the mixture would be recovered. However, now the sketch sizes are no longer fixed and grow linearly with genome size. This sacrifices much of the memory and storage of the MinHash technique.
Koslicki and Zabeti
The Koslicki and Zabeti preprint includes a nice exposition of why MinHash sketches are problematic for estimating containment, and provides examples of how the relative error of this technique explodes when the size of A is much smaller than B. However, as Broder stated in his 1997 paper, MinHash was never intended for this purpose (some words substituted to match the terminology of this post):
The [MinHash sketch] has the advantage that it has a fixed size, but it allows only the estimation of resemblance. The size of [the modulo sketch] grows as [the set] grows, but allows estimate of both resemblance and containment … The disadvantage of this approach is that the estimation of the containment of very short documents into subtantially [sic] larger ones is rather error prone due to the paucity of samples.
This last point is why the modulo approach is problematic for metagenomic applications (e.g. finding a virus in a metagenome). A small modulus would be required to detect the virus, and as a result the sketch of the metagenome would be huge. Instead of the modulo approach, Koslicki takes a MinHash sketch of the k-mers from genome A and a bloom filter of k-mers from (meta)genome B. To estimate the containment of A in B, one simply looks up all of the hash values from the sketch of A in the bloom filter of B. From this, one can estimate containment after accounting for false-positives arising from the bloom filter membership query. Here it would have been nice to see a comparison versus Broder’s modulo approach. To assure a low false-positive rate, bloom filters can require a large amount of space. For the same error bounds, does the bloom filter save substantial space over the modulo approach? Unfortunately, Koslicki does not reference the modulo technique.
Mash Screen
Screen is a new command offered by the Mash toolkit that also answers the containment question. Many of our users wanted to use Mash to quickly determine the composition of their sequencing runs (e.g. for contamination screening), but we knew that the standard MinHash approach was not ideal for this. Like Koslicki, we observed that it was possible to repurpose the reference genome sketches to answer this question, and we already had a sketch database for all of RefSeq. However, rather than use a bloom filter, we use an exact, streaming method to identify which sketch values are found in the sample. Since each sketch is effectively a random sample of the k-mers in a genome, the containment of each genome A in B is simply the fraction of matched values in the sketch of A.
Implementing the streaming approach is straightforward. Because the sketches themselves are quite small (the all RefSeq sketch database is only around 100 MB), it is possible to store a hash table of all sketch values in memory. Then, a set of sequencing reads can be streamed as input and every k-mer quickly checked against this hash table. Each time a k-mer is seen that maps to a sketch element, a counter is incremented using atomic types to support multi-threading. The resulting count table allows us to estimate the containment of every genome in the database, and also provides a rough depth of coverage estimate for each. One advantage of this approach is that it is “online”, meaning the containment and coverage values can be continuously updated during a real-time sequencing run.
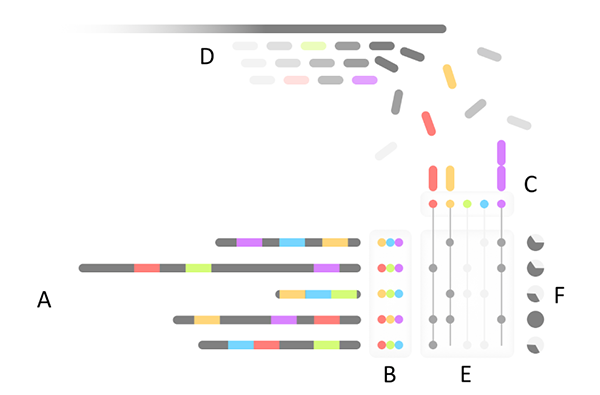
Overview of Mash Screen. (A) A set of reference genomes is processed to produce a (B) sketch database. (C) A hash table of all sketch elements is used to count occurrences in (D) a streaming sequencing mixture. For each genome, (E) the fraction of the sketch observed in the mixture produces (F) a containment estimate.
This new function also includes support for translated blastx-style operations. When calling screen against a protein database, Mash will automatically perform six-frame translation on the input nucleotide sequences. This could be handy for quickly computing containment of viruses or individual genes within metagenomes.
Application
The latest Mash release can be grabbed from here. The new screen operation is compatible with the existing RefSeq sketch database, or a custom database can be created for any collection of sequences (nucleotide or protein). A set of sequencing reads can then be streamed against this database requiring just a few minutes per thread per gigabase of reads:
mash screen RefSeqSketches.msh reads1.fastq reads2.fastq > out
Also check out David Koslicki’s CMash for the bloom filter implementation of containment. A potential advantage of the bloom filter approach is that it could enable indexed search of a bunch of metagenomes. For example, given an indexed database of metagenomes, one could ask the question “In which metagenomes has this new genome been seen before?” Conversely, due to its streaming nature, Mash screen is best suited to answer the question “Which genomes are contained in this new metagenome?” Both tools should be handy for searching large databases, quick contamination checks, and as a pre-filter for read classification. For example, one could run a containment check first and then map reads only to those genomes identified.
Example output
Here are the first 10 lines of output for SRA sample SRS1041159 (tongue dorsum) “screened” against all of RefSeq genomic:
0.997007	939/1000	12	0	Human endogenous retrovirus K113 (viruses)
0.995206	904/1000	53	0	Neisseria flavescens (b-proteobacteria)
0.995206	904/1000	27	0	Haemophilus sp. HMSC061E01 (g-proteobacteria)
0.994784	896/1000	28	0	Haemophilus sp. HMSC068C11 (g-proteobacteria)
0.994199	885/1000	27	0	Rothia sp. HMSC061C12 (high GC Gram+)
0.99339	870/1000	27	0	Rothia sp. HMSC065C12 (high GC Gram+)
0.992899	861/1000	29	0	Rothia sp. HMSC065B04 (high GC Gram+)
0.992844	860/1000	28	0	Haemophilus parainfluenzae (g-proteobacteria)
0.992844	860/1000	25	0	Haemophilus parainfluenzae (g-proteobacteria)
0.992789	859/1000	30	0	Rothia sp. HMSC066G02 (high GC Gram+)
The output columns are [identity, shared-hashes, median-multiplicity, p-value, query-ID]. There are many more lines following, including human further down the list:
0.955446 384/1000 1 0 GCF_000001405.36_GRCh38.p10
A couple things to note. First, the identity score is not the true identity of a genome versus what is in your sample, but what fraction of bases are shared between the genome and your sequencing reads (this is estimated from the fraction of shared k-mers). Sequencing errors and gaps in coverage will reduced the identity estimate. For example, since the human genome is in the sample at low coverage, not all human k-mers are found and the corresponding identity score is reduced.
Second, Mash Screen is not a metagenomic profiler in the traditional sense. When using a comprehensive sketch database there is typically a lot of redundancy in the output. The tool is simply reporting every genome in the database that shares a high fraction of k-mers with the sample. In this example, some microbial genomes are high coverage and so hits pop up to all strains that are similar (e.g. multiple Haemophilus genomes). It is very unlikely that all reported strains are actually there, but Mash is not yet attempting to answer which ones are. It would be great to see additional methods developed to process containment scores, reduce the output redundancy, and report accurate compositional estimates for metagenomes. One easy approach is a “winner take all” model, like sourmash implements. This is now available in Mash as an option to the containment function, but much better methods are possible and left for future work. Check out MetaPalette for some possible inspiration.
We hope you will find these tools useful!